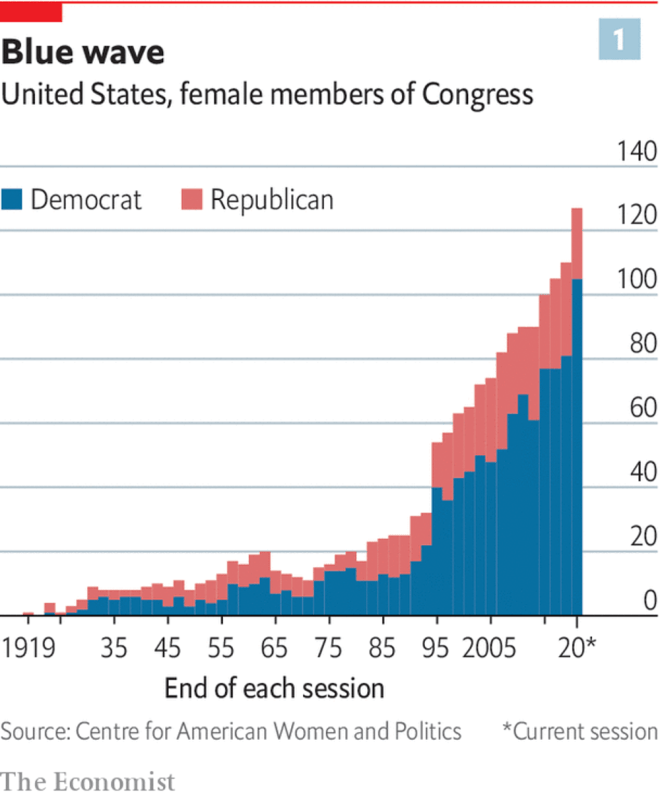
This chart in The Economist bothered me. It’s not a bad chart, but it could convey the data so much better if just the order of columns was reversed.

Once the data is reversed, it’s much clearer to see the relatively stagnant number of Republican women in Congress, along with the increase in Democrat women in Congress.
I used the data from The Economist’s listed source: Centre for American women and politics.
I used a stack area chart because Google Sheets doesn’t give an option to remove the gap between columns in a column chart. The background white in the column gaps makes the republican red hard to observe. The column chart version is below.

The interactive version of my column chart is here.